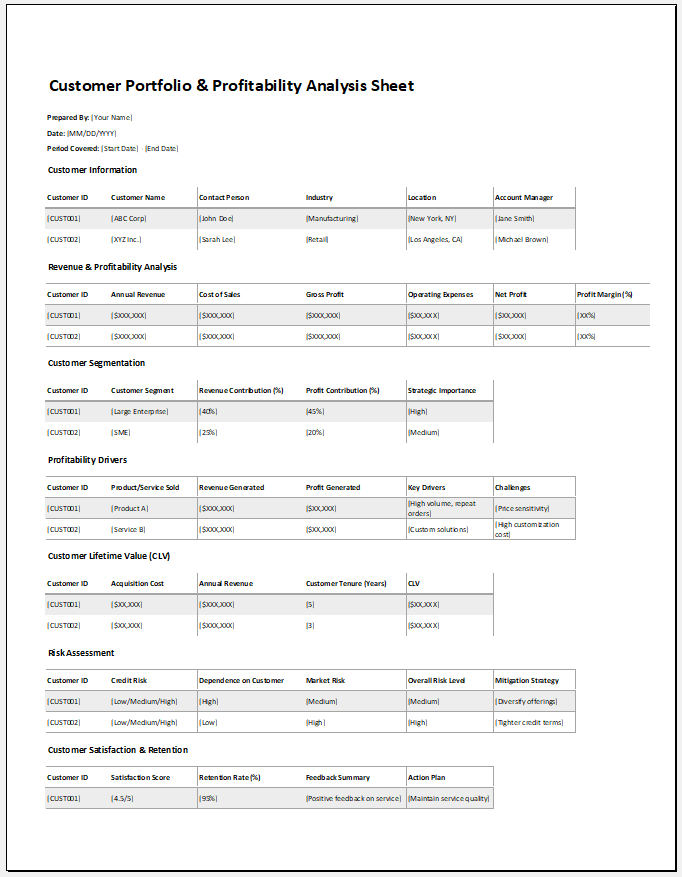
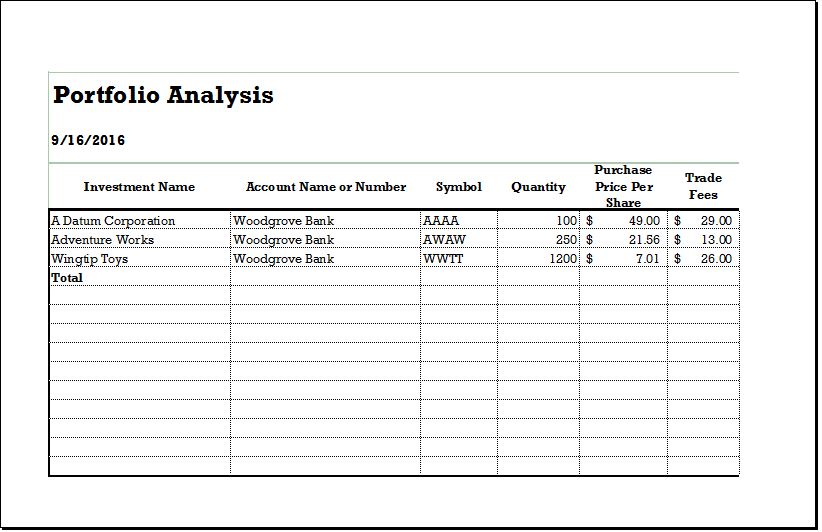
Customer Portfolio & Profitability Analysis Sheet
Customers are important for any business. Without customers, a business will not be able to function and will have to close down. A company needs to know who their target audience is so that they can cater to their needs. This can help a company get profits and prosper.
Companies that keep their customers in mind and research to find out about how they are helping the company out can expand. A business like this can cater to the needs of more and more people. One way to analyze customer behavior which can aid a business includes using customer portfolio and profitability analysis sheets.
What is a customer portfolio & profitability analysis sheet?
This is a sheet that analyzes the revenue that every individual consumer generates. The sheet records various details of different customers so that the company can find out which target audience is drawn to its products.

Excel Worksheet File: 72 KB
What does an analysis sheet do?
The sheet aims to research individual customer profitability so that a company can know which customers are helping it out. The results from the sheet will let a business see which population segments tend to be most profitable for the company and which can help the business grow.
Are you looking for the one?
If a business wants to use the sheet to help it find out individual customer profitability, all details must be added to it. The following points can be kept in mind when making this sheet:
Microsoft Excel:
The sheet needs to have a professional outline so that it can be taken seriously. You can make it in an application like Microsoft Excel. Here you will be able to make tables and charts if necessary so that customer profitability can be analyzed.
Structure of document:
The document needs to have a formal structure. Include a heading like “Customer Portfolio & Profitability Analysis Sheet”. Include the name of the company and add the date. You can then make a table where you include only the important details related to the analysis.
Details to add to the table:
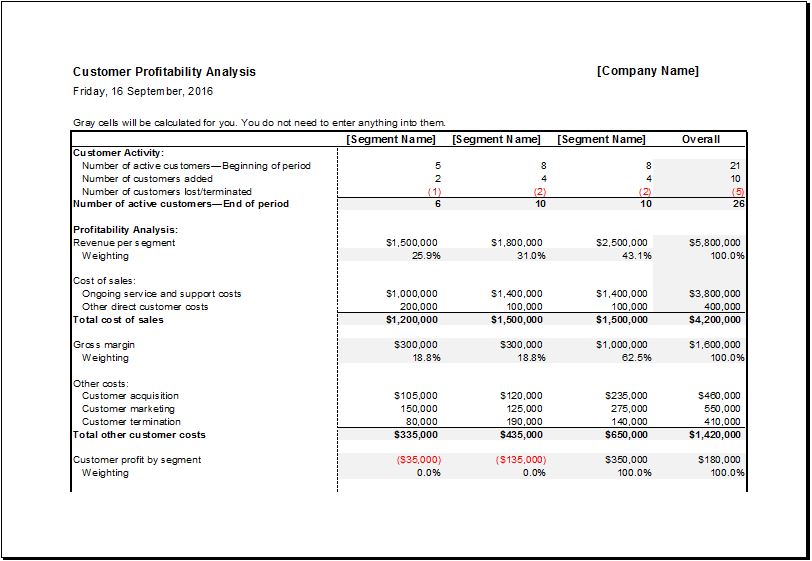
You can have a table for customer activity. There can be separate columns for every customer segment. You can have rows that analyze customer behavior. This can include the number of active consumers, amount of customers added, amount of consumers lost. The details can be filled in accordingly in the rows.
There can be a row at the end that states the number of active consumers at the end of the period. Another table for profitability analysis can be included. This can calculate the revenue per segment and also weighting. Another table that looks at the cost of sales will have rows such as ongoing service plus support expenses, other direct consumer expenses, and the total cost of sales.
There can be a table for summary metrics which will have rows like average cost present per acquired consumer, average cost per terminated consumer, average marketing cost present per active consumer, and average profit or loss per consumer. The details can be filled in accordingly in the given columns.
It is important for a business
This sheet is important for a business when it wants to find out the main behavioral patterns as well as trends that are affecting the top plus bottom lines. The sheet will allow the company to get insights that will help with marketing and sales. A business can figure out areas and methods that will help in enhancing consumer acquisition, development plus retention.
The analysis sheet will help a company analyze different customer segments so that it can figure out which ones are helping the business get more profits.
The company can focus on catering to the requirements of this consumer base when it comes to its marketing strategy, product, etc. Therefore a business will be able to better reach out to the customers most likely to buy from it when policies are introduced to cater to these people. The sheet will help the business gather important information on customers which can help the company run better and get more profits. This can help the business grow and prosper.


- Product Sales Tracker Template
- Debit Memo Template for Excel
- Winter Attire Inventory
- Financial Projections Worksheet
- Employee Absence Tracker
- Weekly Sales Report Template
- Budget Vs Actual Statement
- Remote Work Attendance Tracker
- Mileage Expense Report Template
- Fitness Calendar Template
- Project Gantt Chart
- Daily Attendance Tracker for an Individual Employee
- Overtime Hours Tracker Template
- Vacation and Leave Tracker Template
- Departmental Expense Report Template
← Previous Article
Detailed Sales Forecast TemplateNext Article →
Eyewash Station Maintenance Log
Leave a Reply